Table of Contents >> Show >> Hide
- Why CPU temperature monitoring actually matters
- Quick CPU temperature basics (so the numbers don’t freak you out)
- Tool #1: BIOS/UEFI hardware monitor (built-in, zero downloads)
- Tool #2: Core Temp (fast, lightweight, beginner-friendly)
- Tool #3: HWMonitor (simple interface, lots of sensors)
- Tool #4: HWiNFO (deep detail, still easy once you use “Sensors only”)
- The 5-minute routine: how to check CPU temperature the smart way
- What’s “too hot”? A practical way to think about it
- How to lower CPU temperature (the low-risk fixes first)
- Common mistakes people make when monitoring CPU temp
- Real-world experiences: what monitoring your CPU temp teaches you (the extra-long, very human part)
- Conclusion
Your CPU is the brain of your computerso when it starts running hot, everything else gets a little weird.
Games stutter. Fans scream like they’re auditioning for a horror movie. Your laptop becomes a portable space heater.
Monitoring CPU temperature is one of those “boring” habits that quietly prevents expensive problems.
The good news: checking your CPU temp doesn’t require a physics degree, a screwdriver, or a tiny thermometer taped to your processor.
Modern CPUs already have built-in sensorsyou just need a tool that can read them.
In this guide, you’ll learn four easy ways to monitor CPU temperature, how to interpret the numbers, and what to do if things look spicy.
Why CPU temperature monitoring actually matters
Watching your CPU temperature isn’t about obsessing over every single degree. It’s about catching patterns:
overheating, thermal throttling (when performance drops to prevent damage),
unstable behavior (random restarts, crashes), and cooling issues like dust buildup or a loose heatsink.
Temperature checks are especially useful after you:
- Install a new cooler or reapply thermal paste
- Build a new PC or upgrade a CPU
- Notice louder fans, slower performance, or sudden shutdowns
- Start gaming, streaming, editing video, or running heavy workloads
- Overclock (or even just enable performance modes)
Quick CPU temperature basics (so the numbers don’t freak you out)
1) Idle vs. load is the real story
CPU temps change constantly. At idle (just browsing, emailing, staring at your desktop like it owes you money),
temperatures should generally be much lower than when you’re gaming, rendering, compiling, or stress testing.
The important metric is usually the maximum temperature under your normal workload,
not a random one-second spike.
2) “CPU Package” and “Core temps” can both be useful
Monitoring tools may show multiple readings:
per-core temperatures, CPU package, CPU die, or
motherboard-related sensors like “CPU (socket).”
If you’re unsure, start with CPU Package (or “CPU Die / Average” on some systems) because it often reflects the CPU’s hottest internal area.
3) CPU limits depend on the exact model
CPUs have a manufacturer-defined temperature limit (often referenced as a “junction” maximum).
When the CPU approaches that limit, it will usually protect itself by lowering speed and power (throttling).
That means a CPU getting warm isn’t automatically a crisisbut sustained high temps are a sign to check your cooling setup.
Tool #1: BIOS/UEFI hardware monitor (built-in, zero downloads)
If you want the simplest possible temperature check, your motherboard’s BIOS/UEFI hardware monitor is the “no-apps-required” option.
It’s not great for real-time monitoring during games, but it’s excellent for a quick sanity check after building or upgrading.
How to check CPU temp in BIOS/UEFI
- Restart your PC.
- As it boots, press the BIOS/UEFI key (commonly Del, F2, or F10your screen usually tells you).
- Look for menus like Hardware Monitor, PC Health, H/W Monitor, or Monitoring.
- Find CPU temperature and fan speeds.
Pros
- No software needed
- Works even if Windows is acting up
- Helpful right after installation or troubleshooting
Cons
- Not real-time while gaming or working
- Temps here aren’t always representative of real workload temperatures
Think of BIOS/UEFI temps as a quick “Is the cooling system alive?” checknot the whole story.
Tool #2: Core Temp (fast, lightweight, beginner-friendly)
If you want a simple tool that focuses mainly on CPU temperature, Core Temp is a classic.
It’s easy to read, shows per-core temps, and can sit quietly in your system tray so you can keep an eye on things without turning your desktop into a spaceship dashboard.
Best for
- Quick checks during normal use
- Seeing per-core temperatures easily
- People who want “just the CPU temp,” not every sensor known to humanity
Setup tips (the 60-second version)
- Install Core Temp.
- Open it and note the temperature readings for each core.
- Optional: enable tray icons so temps are visible at a glance.
How to use it like a pro (without becoming a pro)
- Record your max while doing your real workload (game, edit, stream, etc.).
- Pay attention to sustained temperatures rather than momentary spikes.
- If you’re troubleshooting, check temps before and after changes (cleaning dust, adjusting fan curves, reseating cooler).
Tool #3: HWMonitor (simple interface, lots of sensors)
HWMonitor is popular because it’s straightforward and wide-ranging:
it reads temperatures, voltages, fan speeds, and other health sensors.
If you’re trying to confirm whether your issue is truly CPU-relatedor part of a bigger cooling/airflow problemHWMonitor is a handy step up from “CPU-only” tools.
Best for
- Monitoring CPU temp plus fan speeds and other thermal sensors
- Spotting patterns using Min/Max temperature columns
- Quick troubleshooting (e.g., “Are my fans ramping up at all?”)
How to read HWMonitor without getting lost
HWMonitor can look like a spreadsheet got really into fitness tracking. Use this approach:
- Find your CPU section.
- Look for Temperatures and focus on CPU package/core temps first.
- Check the Max column after you run your workload for 10–30 minutes.
If you see multiple “CPU” temperature entries (package, socket, motherboard), don’t panic.
Different sensors measure different points. For real overheating risk, internal CPU readings are usually the most relevant.
Tool #4: HWiNFO (deep detail, still easy once you use “Sensors only”)
If HWMonitor is a helpful snapshot, HWiNFO is the full documentary seriesdirector’s cut, behind-the-scenes, and commentary included.
But here’s the secret: you don’t have to use all of it.
Launch Sensors-only mode and it becomes a clean, powerful way to watch CPU temperature, max temps, and even log data to a file.
Best for
- Accurate sensor naming and detailed readings
- Logging temps over time (great for diagnosing random spikes)
- Power users who want more than one number (without sacrificing clarity)
A simple HWiNFO workflow that actually works
- Open HWiNFO and choose Sensors (or “Sensors-only”).
- Find your CPU temperature readings (often “CPU Package” or “CPU Die / Average”).
- Run your normal workload for 15–30 minutes.
- Check the Maximum value.
- If troubleshooting, enable logging to review a temperature timeline later.
Logging is especially useful when your PC only misbehaves “sometimes,” which is a very real and extremely annoying category of problems.
The 5-minute routine: how to check CPU temperature the smart way
Here’s a quick routine you can repeat anytime you change something:
Step 1: Establish a baseline
Let your PC sit idle for a few minutes, then note the CPU temperature (and fan speeds if your tool shows them).
This is your “calm day” reference.
Step 2: Test your real workload
Don’t jump straight to extreme stress tests unless you’re diagnosing a serious issue.
Instead, run what you actually do: your favorite game, a render, a big spreadsheet, a compile, a stream.
Check the max temp after 10–30 minutes.
Step 3: Look for trends, not drama
- Is the CPU steadily climbing and never leveling off?
- Do temps spike instantly the moment you open anything?
- Are fans not reacting at all?
- Is performance dropping while temps rise (possible throttling)?
What’s “too hot”? A practical way to think about it
The most accurate answer is: it depends on your CPU model.
Different chips have different temperature limits, and laptops often run warmer than desktops by design.
A practical approach:
- Check your CPU’s specified limit (manufacturer documentation) so you know the true ceiling.
- Watch whether you’re approaching that limit often during normal use.
- If temps are near the ceiling and you see performance drops, you’re likely hitting thermal control behavior.
Bottom line: one warm moment is normal. Consistently living at the edge of the limit is a sign to improve cooling, airflow, or power settings.
How to lower CPU temperature (the low-risk fixes first)
If your monitoring tool shows high temperatures, start with the easiest wins:
1) Clean dust and improve airflow
Dust is basically an insulating blanket for your heatsinks. (Your PC does not want a blanket.)
Cleaning intake filters and heatsinks can produce surprisingly real temperature dropsespecially in older systems.
2) Check fan behavior
If fans never ramp up, your system may be using a quiet profile or a misconfigured fan curve.
Many motherboards let you set fan curves in BIOS/UEFI, and many PCs/laptops have manufacturer utilities for thermal profiles.
3) Reseat the cooler (if temps are wildly high)
A cooler that isn’t making full contact can cause unusually high temperatures fast.
If your temps look extreme immediately under light load, this is worth checkingespecially right after a build or upgrade.
4) Reduce unnecessary background load
If your CPU is doing “mystery work” at idle, temps will be higher.
Check background apps, browser tabs, game launchers, and anything that auto-starts.
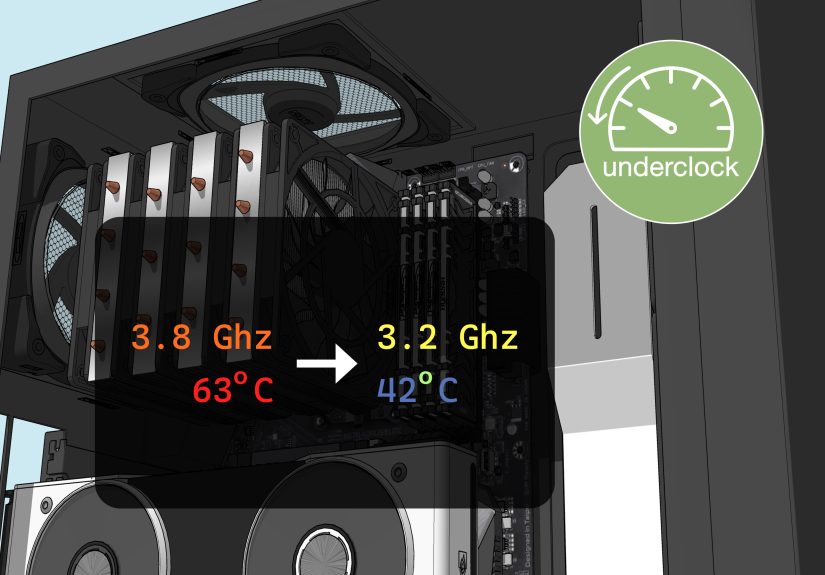
5) Consider power tuning (optional, advanced-ish)
On some systems, adjusting power limits or using a balanced power plan can reduce temperatures without sacrificing much performance.
This is especially common on laptops where “Turbo Everything Forever” sounds fun until the fans hit jet-engine levels.
Common mistakes people make when monitoring CPU temp
- Only watching the current temp and ignoring max temps (max matters more).
- Comparing temps across different CPUs like it’s a personality contest.
- Trusting one reading label blindly (“CPU” can mean different sensors depending on your system).
- Installing three monitoring tools at once and wondering why the PC feels busier than a coffee shop on Monday.
- Focusing on a single number instead of behavior: stability, fan response, performance consistency.
Real-world experiences: what monitoring your CPU temp teaches you (the extra-long, very human part)
Monitoring CPU temperature is one of those habits that feels unnecessary… right up until it saves you.
Here are some common experiences people run intoand the lessons that usually follow.
Experience #1: “My PC is loud, but it’s fine… right?”
A lot of people notice fan noise first. Maybe it starts during games, then slowly becomes an “all the time” soundtrack.
They finally open a monitoring tool and see that temperatures don’t just spikethey stay elevated for long stretches.
The surprise isn’t that the CPU runs warm under load; it’s that the system never really cools down afterward.
That’s usually when airflow issues show up: blocked intakes, dust-choked filters, or a case that looks cool but breathes like it’s wearing a scarf indoors.
The lesson? Temperatures aren’t just a number. They’re a pattern. If your CPU temp drops quickly after load ends, cooling is doing its job.
If it lingers, your PC is basically asking for better ventilationpolitely, with fan noise.
Experience #2: “Why do two apps show different temperatures?”
This is a classic: one tool reports a comfortable temperature, another says your CPU is auditioning for a volcano documentary.
The first time that happens, it’s easy to assume one app is “wrong.” More often, they’re reading different sensors or interpreting the same sensor differently.
Some report “CPU Package,” some show an average, some focus on the hottest core, and some include motherboard socket sensors.
The fix isn’t to hunt for the “one true number.” The fix is to pick one tool, pick one main metric (package/die temperature is often the best starting point),
and track trends using the maximum value under the same workload.
The lesson? Consistency beats perfection. You’re trying to answer: “Is my system hotter than it used to be?”not “Can I win an argument on the internet?”
Experience #3: “My temps are high only in one game (and only after 20 minutes)”
This one is sneaky. You play for a while, everything feels smooth, then frame rates dip and the fans become emotionally invested in your existence.
You check temps and realize the CPU climbs gradually until it hits a point where performance starts to flatten or drop.
That often points to a cooling system that can handle short bursts but struggles with sustained heatcommon in small cases and many laptops.
Logging temperatures (especially with a tool that records max values over time) makes the pattern obvious: a steady climb, then a plateau, then throttling.
The lesson? Short tests don’t tell the full story. If you want real answers, monitor over the same time window you actually use your PC.
Your CPU doesn’t overheat on your scheduleit overheats on physics’ schedule.
Experience #4: “I upgraded my CPU and suddenly everything runs hotter”
Upgrading a CPU can change heat output dramaticallyespecially if you move to a higher-performance chip or enable aggressive boost behavior.
People often assume the old cooler will “probably be fine,” then the temperature data says otherwise.
Sometimes it’s not even the cooler itselfit’s installation details: slightly uneven mounting pressure, a fan plugged into the wrong header,
or a case airflow setup that worked for the old CPU but can’t keep up now.
The monitoring tools make troubleshooting less emotional: you can test with the side panel on vs. off, adjust fan curves, clean dust,
and see changes reflected in max temps.
The lesson? Monitoring turns upgrades from guesswork into a controlled experiment.
And controlled experiments are way less expensive than replacing hardware because you ignored the warning signs.
The overall takeaway: CPU temperature monitoring isn’t about staring at numbers all day.
It’s about building confidence that your system is healthy, stable, and cooling itself correctlywhether you’re gaming, working, or just browsing.
Conclusion
If you want the simplest path: start with BIOS/UEFI for a quick check, then use a lightweight tool like Core Temp for everyday monitoring.
If you need more context, HWMonitor adds a bigger sensor view, and HWiNFO is the best option for deep detail and logging.
Track max temperatures during your real workload, watch trends over time, and treat your CPU like a valuable componentnot a toaster with Wi-Fi.