Table of Contents >> Show >> Hide
- Before You Calculate: Two Quick “ECG Reality Checks”
- The Landmark You’ll Use: The R Wave (QRS Complex)
- Method 1: The 300 Rule (Big Box Method)
- Method 2: The 1500 Rule (Small Box Method)
- Method 3: The 6-Second (Strip) Method
- Which Method Should You Use?
- Practical Tips to Make Your Heart Rate Math More Trustworthy
- Quick Self-Check: Three Mini Practice Scenarios
- Conclusion
- Real-World Experiences: What It Actually Feels Like to Use These Methods
An ECG (also called an EKG) is basically your heart’s “electrical diary.” It records beats, pauses, and the occasional dramatic flairon a grid that looks like graph paper had a very organized baby with a printer. The cool part: once you know how to use that grid, you can calculate heart rate in secondswhether you’re reading a 12-lead printout, a rhythm strip, or a monitor strip.
This guide breaks down three reliable, classic ways to calculate heart rate from an ECG: the 300 rule, the 1500 rule, and the 6-second (strip) method. You’ll also learn when each method shines, how to avoid common mistakes, and how to handle rhythms that refuse to be politely regular.
Before You Calculate: Two Quick “ECG Reality Checks”
1) Confirm the paper speed (because math hates surprises)
Most ECGs are recorded at 25 mm/second. That matters because the boxes represent time:
- 1 small box (1 mm) = 0.04 seconds
- 1 large box (5 small boxes) = 0.20 seconds
- 5 large boxes = 1 second
Some ECGs use 50 mm/second (often for fast rhythms), where everything is “stretched”: small boxes become 0.02 seconds and large boxes become 0.10 seconds. Translation: the shortcut numbers change. If the strip tells you the paper speed, believe it. If it doesn’t, look for the standard calibration marks.
2) Decide if the rhythm is regular or irregular
Your choice of method depends on this:
- Regular rhythm: The R-to-R distance (the space between QRS complexes) is consistent. Use the 300 or 1500 rule for fast, accurate results.
- Irregular rhythm: R-to-R varies noticeably. Use the strip method (and/or average multiple intervals) so one “weird” beat doesn’t hijack your math.
The Landmark You’ll Use: The R Wave (QRS Complex)
When calculating heart rate, you’re typically counting ventricular rate by measuring the distance between QRS complexesusually using the peak of the R wave because it’s the easiest tall spike to spot. (If you’re calculating atrial rate in certain rhythms, you may use P waves or flutter wavesbut for most everyday “What’s the rate?” situations, QRS is the MVP.)
Method 1: The 300 Rule (Big Box Method)
Best for: Regular rhythms when you want a fast estimate that’s usually close enough for real life. This is the method people use when they’re standing at a bedside with a pen, a strip, and exactly seven seconds of patience.
How it works
- Pick one R wave peak (a QRS complex).
- Find the next R wave peak right after it.
- Count the number of large boxes between them.
- Calculate: Heart Rate (bpm) = 300 ÷ number of large boxes (assuming paper speed is 25 mm/s).
Why 300?
At 25 mm/s, each large box is 0.20 seconds. Five large boxes = 1 second, so there are 300 large boxes in one minute. That’s where the 300 comes from. Your heart rate is basically “how many of those intervals fit into a minute.”
Example
If the distance between two R waves is 4 large boxes:
300 ÷ 4 = 75 bpm
The “memory lane” shortcut (no calculator, no shame)
If the rhythm is regular, you can use this sequence by counting large boxes between R waves:
- 1 large box ≈ 300 bpm
- 2 large boxes ≈ 150 bpm
- 3 large boxes ≈ 100 bpm
- 4 large boxes ≈ 75 bpm
- 5 large boxes ≈ 60 bpm
- 6 large boxes ≈ 50 bpm
If the R-R interval lands between numbers, estimate. For example, 3.5 large boxes lands between 100 and 75, so you’re around ~85 bpm. Not perfect, but quickand often that’s exactly what you need.
Common mistakes with the 300 rule
- Using it on irregular rhythms: one short interval can make the rate look faster than it “averages out.”
- Counting boxes from the wrong spot: use R peak to R peak (or consistent points on each QRS).
- Forgetting paper speed: 300 is for 25 mm/s, not automatically for everything.
Method 2: The 1500 Rule (Small Box Method)
Best for: Regular rhythms when you want more precision than the 300 rule. If the big box method is a quick text message, the 1500 rule is a full sentence with punctuation.
How it works
- Pick an R wave peak.
- Find the next R wave peak.
- Count the number of small boxes between them.
- Calculate: Heart Rate (bpm) = 1500 ÷ number of small boxes (at 25 mm/s).
Why 1500?
At 25 mm/s, each small box is 0.04 seconds. There are 25 small boxes per second, which means 1500 small boxes per minute (25 × 60 = 1500).
Example
If there are 20 small boxes between two R waves:
1500 ÷ 20 = 75 bpm
Bonus: The “60 over RR” method (same idea, different outfit)
Another precise approach is to measure the R-R interval in seconds, then use:
Heart Rate (bpm) = 60 ÷ R-R interval (seconds)
Example: If R-R interval is 0.80 seconds, then 60 ÷ 0.80 = 75 bpm. This is especially handy on digital ECG systems that give you interval timing.
When NOT to use the 1500 rule
- Irregular rhythms: you’ll get wildly different answers depending on which two beats you pick.
- Ectopy (extra beats): a premature beat can shorten one interval and inflate the “rate” artificially.
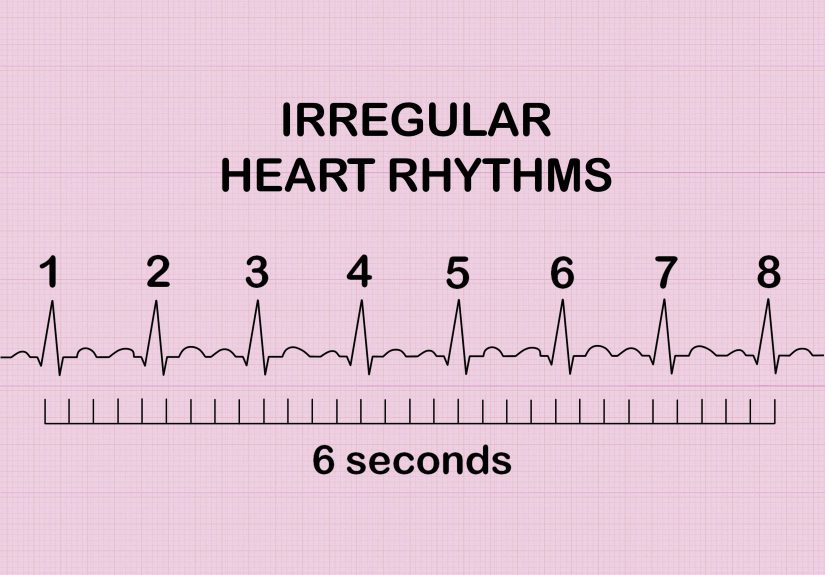
Method 3: The 6-Second (Strip) Method
Best for: Irregular rhythms or when you need an average rate over time. This method treats the ECG like a sample window and asks, “How many beats happened in this chunk?” It’s the heart-rate equivalent of counting how many cookies you ate during a movie and multiplying by “per hour.” (No judgment. Math is neutral.)
How it works (classic 6 seconds)
On standard ECG paper at 25 mm/s:
- 30 large boxes = 6 seconds
- Mark a span of 30 large boxes (6 seconds).
- Count how many QRS complexes occur in that 6-second window.
- Multiply by 10 to estimate bpm.
Heart Rate (bpm) = number of QRS in 6 seconds × 10
Example
If you count 8 QRS complexes in 6 seconds:
8 × 10 = 80 bpm
10-second variation (very common on 12-lead printouts)
Many ECG printouts include a 10-second rhythm strip. If your strip is 10 seconds:
Heart Rate (bpm) = number of QRS in 10 seconds × 6
Example: 11 QRS in 10 seconds → 11 × 6 = 66 bpm.
Why the strip method is great for irregular rhythms
When the rhythm is irregular (like atrial fibrillation), any single R-R interval can be shorter or longer than the next. Counting beats over a time window gives a more honest average rate. It’s also helpful for very slow rhythms where the 300/1500 methods can feel like waiting for a bus that may or may not exist.
Which Method Should You Use?
- Regular rhythm + speed needed: Use 300 rule.
- Regular rhythm + precision needed: Use 1500 rule (or 60/RR).
- Irregular rhythm (or you want an average): Use the 6-second/10-second strip method.
Practical Tips to Make Your Heart Rate Math More Trustworthy
Average multiple intervals when things are messy
If the rhythm is “mostly irregular,” you can estimate rate by averaging several R-R intervals: measure 3–5 consecutive R-R intervals, find the average, then use 60/average RR (seconds). This reduces the impact of one weird beat. It’s like taking the average of your quiz scores instead of letting one surprise pop quiz define your entire personality.
Count QRS complexes, not P waves (unless you mean to)
Heart rate can be described as atrial or ventricular depending on what you count. Most clinical “heart rate” references ventricular rate (QRS complexes). In some rhythms (like atrial flutter), atrial activity can be much faster than ventricular activity. Make sure you’re counting the waveform that matches the question you’re trying to answer.
Watch for artifacts and pacer spikes
Movement artifacts can mimic spikes; pacer spikes can be tiny and easy to miss. If you’re unsure, zoom in (digitally) or pick the clearest lead. A clean R wave is worth more than a heroic guess.
Remember: paper speed changes your shortcuts
If the paper speed is 50 mm/s, the math shortcuts built for 25 mm/s will mislead you. The principles still work (rate is still “60 seconds divided by cycle length”), but the box timing changesso verify speed before you commit.
Quick Self-Check: Three Mini Practice Scenarios
Practice #1 (300 rule)
You measure 3 large boxes between R waves. Rate = 300 ÷ 3 = 100 bpm.
Practice #2 (1500 rule)
You count 25 small boxes between R waves. Rate = 1500 ÷ 25 = 60 bpm.
Practice #3 (strip method)
In a 10-second rhythm strip, you count 14 QRS complexes. Rate = 14 × 6 = 84 bpm.
Conclusion
Calculating heart rate from an ECG isn’t mysteriousit’s just box-based time math with a heartbeat soundtrack. For regular rhythms, the 300 rule gives you speed and the 1500 rule gives you precision. For irregular rhythms, the 6-second/10-second strip method gives you a fair average that doesn’t get fooled by one odd interval. Always confirm the paper speed, count consistently, and when the rhythm gets chaotic, take a longer sample window (or average multiple intervals).
Friendly note: This article is for education and skill-building. If you’re reviewing an ECG because you or someone else has symptoms like chest pain, fainting, severe shortness of breath, or a racing heartbeat that feels wrong, seek medical care promptly.
Real-World Experiences: What It Actually Feels Like to Use These Methods
If you’ve ever tried calculating heart rate from an ECG in the wild (not the quiet, perfect world of practice strips), you already know the truth: the math is easy, but the moment can be loud. A monitor is beeping, someone is asking, “What’s the rate?” and your brain is flipping through its mental filing cabinet like it’s looking for a passport at the airport. That’s exactly why the three methods existbecause different situations demand different kinds of speed and accuracy.
In calm settingslike studying, chart review, or teachinga lot of people start with the 1500 rule because it feels satisfyingly exact. Counting small boxes is almost meditative: you line up R peaks, count tiny squares, and end up with a number that makes you feel like you could solve a mystery with a ruler. It’s also the method that builds confidence, because it forces you to understand the grid and time scale. Many learners describe a “click” moment the first time they realize they’re not memorizing a trickthey’re measuring time and converting it to beats per minute.
Then you meet real life, where speed matters, and the 300 rule suddenly becomes your best friend. In clinical practice and training environments, people love the big-box method because it’s fast enough to use while you’re still processing what you’re seeing. You don’t have to be perfect to be helpful: if you can tell the difference between ~60, ~100, and ~150 bpm in a few seconds, that information is immediately useful. It’s also surprisingly easy to remember because the sequence feels like a little rhythm of its own: 300, 150, 100, 75, 60, 50. Once you’ve used it a few times, it turns into muscle memorylike dialing a friend’s number without thinking (or like reaching for snacks during a movie without remembering you did it).
The most “real-world” method, though, might be the 6-second/10-second strip method, because it’s the one you reach for when the rhythm refuses to behave. Irregular rhythms can make people feel like their math skills suddenly disappeared, but the strip method takes the pressure off: instead of trying to force order onto chaos, you sample a window and calculate an average. On a 12-lead ECG printout, that 10-second rhythm strip is practically begging you to count QRS complexes and multiply by six. In telemetry and bedside monitoring situations, marking six seconds and multiplying by ten can be faster than trying to pick two “representative” beats when every interval looks different.
A very common experienceespecially for students and new cliniciansis realizing that the hardest part isn’t the formula. It’s choosing the right method and counting consistently. People often start by measuring the “prettiest” R-R interval they can find, only to discover the rhythm is irregular and their answer swings wildly depending on the beats they chose. That’s when experienced mentors usually say something like, “Zoom outcount over time.” It’s a small shift that makes a huge difference.
Another “welcome to reality” moment is paper speed. Most of the time it’s 25 mm/s, but occasionally you’ll see 50 mm/s used for fast rhythms. The first time someone forgets to check and ends up with a rate that makes no clinical sense, they never forget again. It becomes a habit: paper speed, rhythm regularity, then rate. Once that pattern is locked in, heart-rate calculation starts to feel less like a test question and more like a practical tool you can trust.
And finally: almost everyone who gets comfortable with ECG rate calculation has at least one “Aha!” storylike the day they looked at a strip and instantly recognized “about 150” just by seeing two big boxes between R waves. That’s the goal. Not to turn you into a human calculator, but to make the ECG grid feel familiar enough that the numbers come naturallyno panic, no drama, and definitely no pretending you can’t find your pen while secretly counting boxes in your head.